Research Services | Neural Circuit Tracing + Targeted Spatial Omics + Neuronal Classification Analysis (with Case Studies) ()
Service Overview
As neuroscience research advances into a multidimensional era of “cell type–circuit–behavior” analysis, traditional neuron classification methods based on antibody labeling face several limitations—such as insufficient antibody specificity, high cost, and low throughput (e.g., difficulty labeling multiple proteins on the same brain slice). These challenges significantly hinder the in-depth investigation of complex neural circuits and disease mechanisms.
To overcome these barriers, we have launched an innovative research service: “Neural Circuit Tracing + Targeted Spatial Omics + Neuronal Classification Analysis.” After performing neural circuit tracing, we apply spatial transcriptomics to the brain tissue containing the labeled neurons. This approach enables the integration of anatomical connectivity data from tracing with spatially resolved gene expression profiles.
Such integration allows researchers to directly associate labeled neurons with their molecular characteristics—such as expression levels of specific genes or neuronal subtypes—thereby uncovering direct links between neuron types, circuit connectivity, and functional states.
Technical Principles and Advantages
This service is built upon three core technologies:
01 Neural Circuit Tracing Technology
Utilizing viral tools such as AAV, RV, and PRV, this technique enables anterograde/retrograde and trans-synaptic labeling, allowing precise mapping of neuronal projection pathways.
A novel targeted spatial omics technology featuring high sensitivity, high specificity, and high resolution. It enables qualitative and quantitative detection at single-base and subcellular levels, allowing the construction of single-cell spatial maps. MiP-seq is widely applied in fields such as neuroscience, development, and oncology.
3.Multidimensional Data Analysis and Visualization:
Integrating image processing, cell segmentation, gene expression quantification, and spatial localization to elucidate the relationships between neuron types and circuit functions.
Service Process
1. Experimental Design: Determine the labeling strategy based on research objectives (retrograde/anterograde viral tracing, monosynaptic/polysynaptic tracing), select the appropriate virus type, and design or choose the target marker probe panel.
2. Viral Labeling and Tissue Processing: Process samples following the workflow of “virus injection → tissue collection → fixation → sucrose dehydration and sedimentation → OCT embedding → cryosectioning.”
3. Targeted Spatial Transcriptomics: Localization and quantitative detection of mRNA at the targeted spatial transcriptomic level.
4. Multidimensional Data Integration and Analysis: Analyze the neuron types, quantities, and spatial distribution labeled by the tracing virus.
Service Advantages
1.High-Specificity Probes and Comprehensive Panel: Precise Identification of Neuronal Subtypes
We screen key neuronal cell types to select target sequence regions with high hybridization efficiency and strong specificity, and design dedicated hybridization probes. The integrated targeted panel includes more than 30 neuronal markers, enabling precise identification of various neuronal subtypes. This allows accurate differentiation of different neuron types within complex neuronal populations, laying a solid foundation for in-depth research on neuronal characteristics and functions.
2.Comprehensive Deliverables: One-Stop Presentation of Scientific Findings
Includes raw images (e.g., virus-labeled fluorescence images, gene in situ hybridization images), analytical charts (e.g., spatial distribution maps of neuronal subtypes, gene expression box plots/heatmaps), statistical results, and conclusions. All are compiled into a final report that visually and clearly presents the research outcomes.
3.Broad Application Prospects: Spanning Multiple Research Fields
Applicable to various areas within neuroscience. In developmental neuroscience, it enables tracking of neuronal changes during development; in neurodegenerative disease research, it helps identify disease-associated neuronal alterations and potential therapeutic targets; in the study of psychiatric disorders, it supports the exploration of abnormal brain neural circuits.
Case Results Display
To investigate the neuronal types in the prelimbic cortex (PrL) of mice that project to the ventral tegmental area (VTA) of the midbrain, RV retrograde trans-synaptic tracing virus was injected into the VTA. After tissue sectioning, in situ hybridization was performed. The detection panel included choline acetyltransferase (ChAT), dopamine transporter (DAT), vesicular glutamate transporter 1 (VGLUT1), vesicular glutamate transporter 2 (VGLUT2), vesicular GABA transporter (VGAT), and serotonin transporter (SERT).
1.Image Calibration
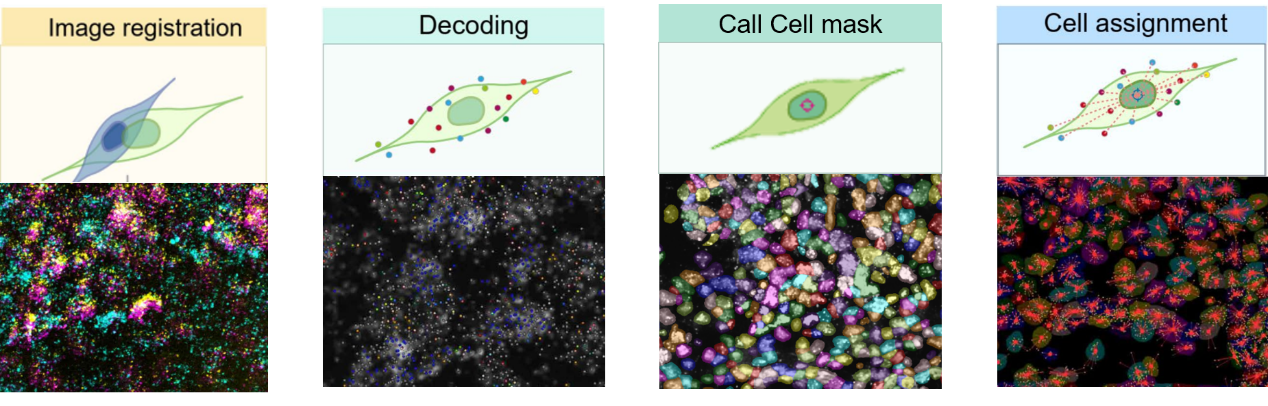
The acquired images were adjusted and optimized to correct or eliminate image batch deviations caused by various factors (such as equipment differences, lighting conditions, experimental operations, etc.), making the images more accurate, consistent, and reliable.
Quantification and localization of fluorescence signals. Quantification refers to measuring the intensity, area, or other relevant parameters of the fluorescence signals to reflect their expression levels in biological samples. Localization refers to determining the precise position of the fluorescence signals in the image to analyze their spatial distribution and interactions.
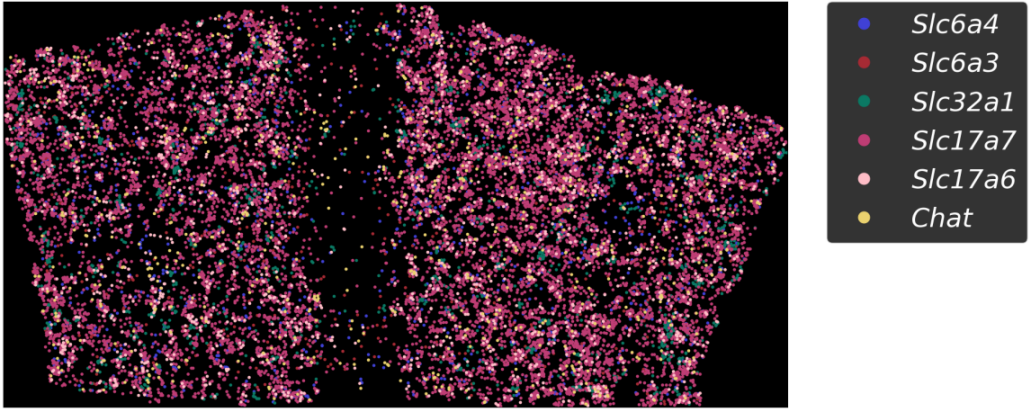
Figure 2: Distribution map of all genes (dots in different colors represent signal spots of different genes)
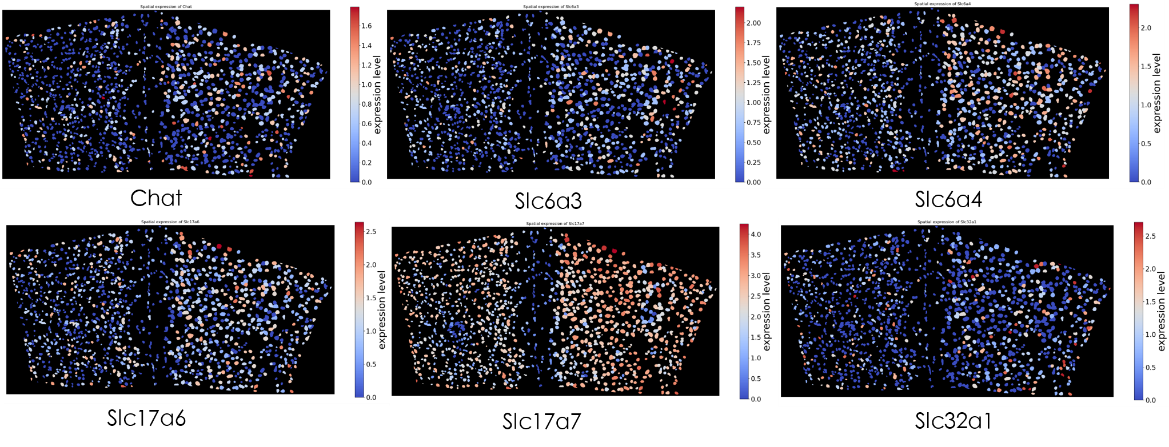
Figure 3: Distribution map of a single gene (expression profile of a single gene)
3.Cell Segmentation and Signal Spot Assignment
Image processing and analysis to identify and define cell boundaries, thereby enabling the localization and segmentation of individual cells.
Figure 5: Gene-cell distribution map (blue/gray indicates cell nuclei; dots in different colors represent signal spots of different genes)
4.Data Statistics
Statistical analysis of the expression of six genes in virus-traced labeled cells.
Figure 6: Gene expression box plot
Figure 7: Gene in situ expression heatmap
Based on the experimental results, among the neurons in the prelimbic cortex projecting to the ventral tegmental area of the midbrain, Slc17a7-positive cells represent the major subtype, accounting for approximately 63% of the total. All the tracing viral vectors mentioned in the article are available from the Brain Case Team. In addition, we offer comprehensive experimental services related to these tracers, including in vivo viral delivery, tissue sectioning, and imaging. If you’re interested, please feel free to contact us at [email protected]
Service Type :
Select the service you'd like to purchase.
Order Information(Premade-AAVs)
Please provide us some information about the service you'd like to order.
Order Information(Custom AAV/Lentivirus)
Please provide us some information about the service you'd like to order.
Order Information(Others)
Please provide us some information about the service you'd like to order.